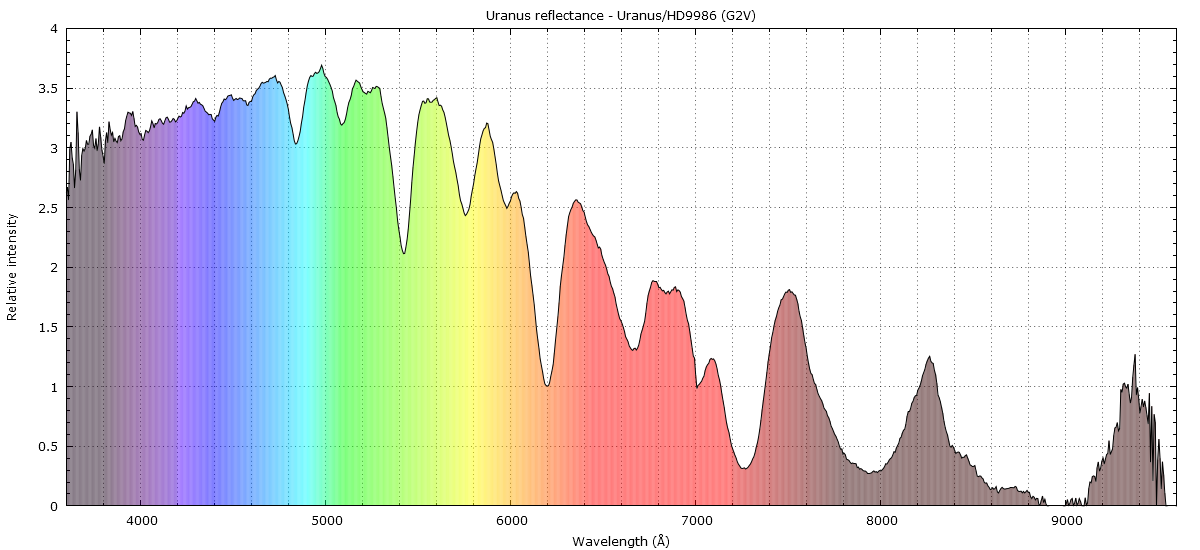
Spectroscopy is a powerful technique to analyse and understand the celestial objects. It provides us with information about their chemical composition, the quantity of emitted light… Here is a low resolution spectrum of Uranus, commented for pedagogy.
This spectrum has been obtained on December 9th, 2018, with a Star Analyzer 100. This is a very low resolution grating whose main purpose is to obtain a quick view on the stars spectra. For the full processing, I obtained shortly after another spectrum from a nearby solar-like star, HD9986 in Pisces. This is an almost solar twin of same spectral type, G2V (G means a yellow star, 2 is the luminosity class (0 to 9) and V is the stellar evolution, here a main sequence star).
For technical reasons (the red end of the first order spectrum is mixed with the blue end of the second order spectrum with the SA100), I have obtained both spectra in two parts, one with the grating alone, and a second one with a Baader IR685 infrared-pass filter, to eliminate the blue mixing. Both parts have been soldered to restore the full spectrum corresponding to the sensitivity of an amateur camera (click for full resolution):

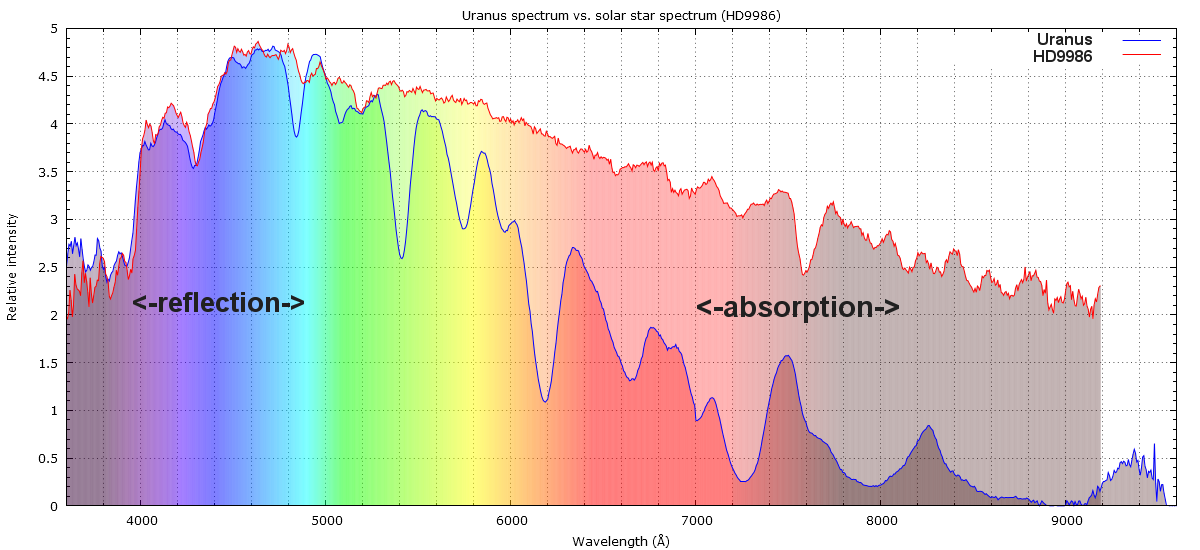
Reading the curve is simple: the more intense (higher) it is, the better is the reflectance. It’s easy to see that Uranus looks to reflect blue and green very well, but quite not so red and infrared. If we compare the spectrum of the planet, but without removing the solar properties, with the spectrum of the reference star, we understand better what is going on:
As the almost perfect reflectance of the planet in blue and green shows it, the light curve of both Uranus and the solar star is largely identical in those colours. But in red and infrared, the light curve of Uranus is noticeably fainter than that of the star: in these two colours, the light from the Sun is mainly absorbed by the atmosphere of the planet. This is why we see at the eyepiece a blue-green Uranus.
Here is finally the full spectrum of the planet as we gather it in the telescope, corrected from the camera response and the global atmospheric absorption. This spectrum is then solar light inequally reflected by Uranus, and locally absorbed by some molecules in our own terrestrial atmosphere. These last bands are too much absorbed by Uranus to be clearly seen in its spectrum but they can be spotted on that of the star in the preceding graph (mainly the deep O2 band at 7605 Angströms). There are still some bands that I could not identify, above all that at 790/800 nm, if anyone knows…
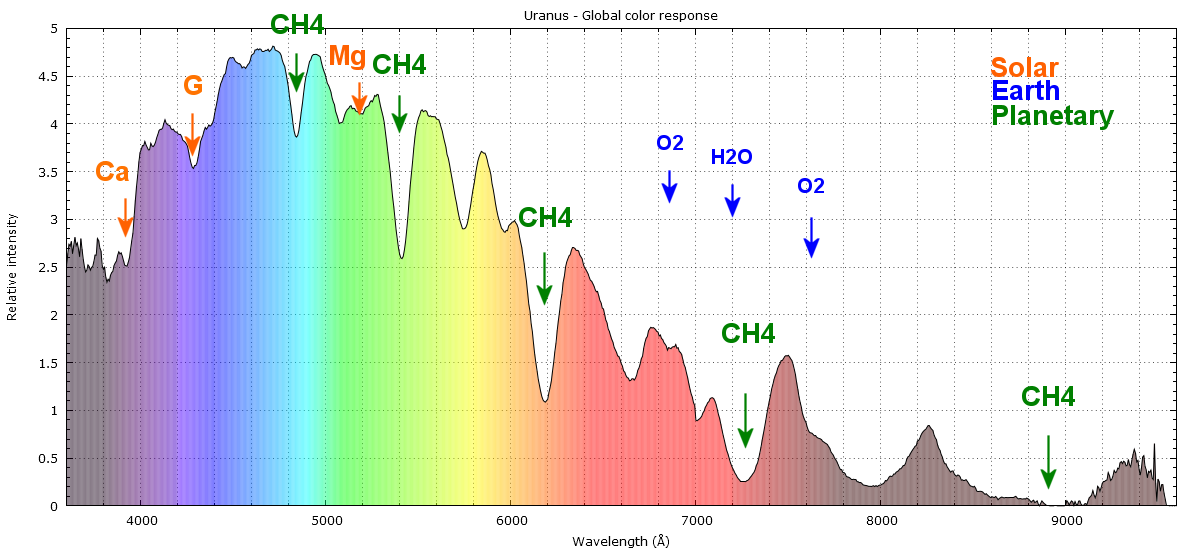
Terrestrial bands: Water and oxygen molecules.
Planetary bands: methane (CH4)

